Hello there,
Greetings from the party aboard the Armstrong. The NORSE pilot has entered its last week and we’ve wrapped up the last few deep CTD casts, deployed some more surface drifters, recovered the SWIFTs and are in the process of picking up all the different gliders we deployed earlier.
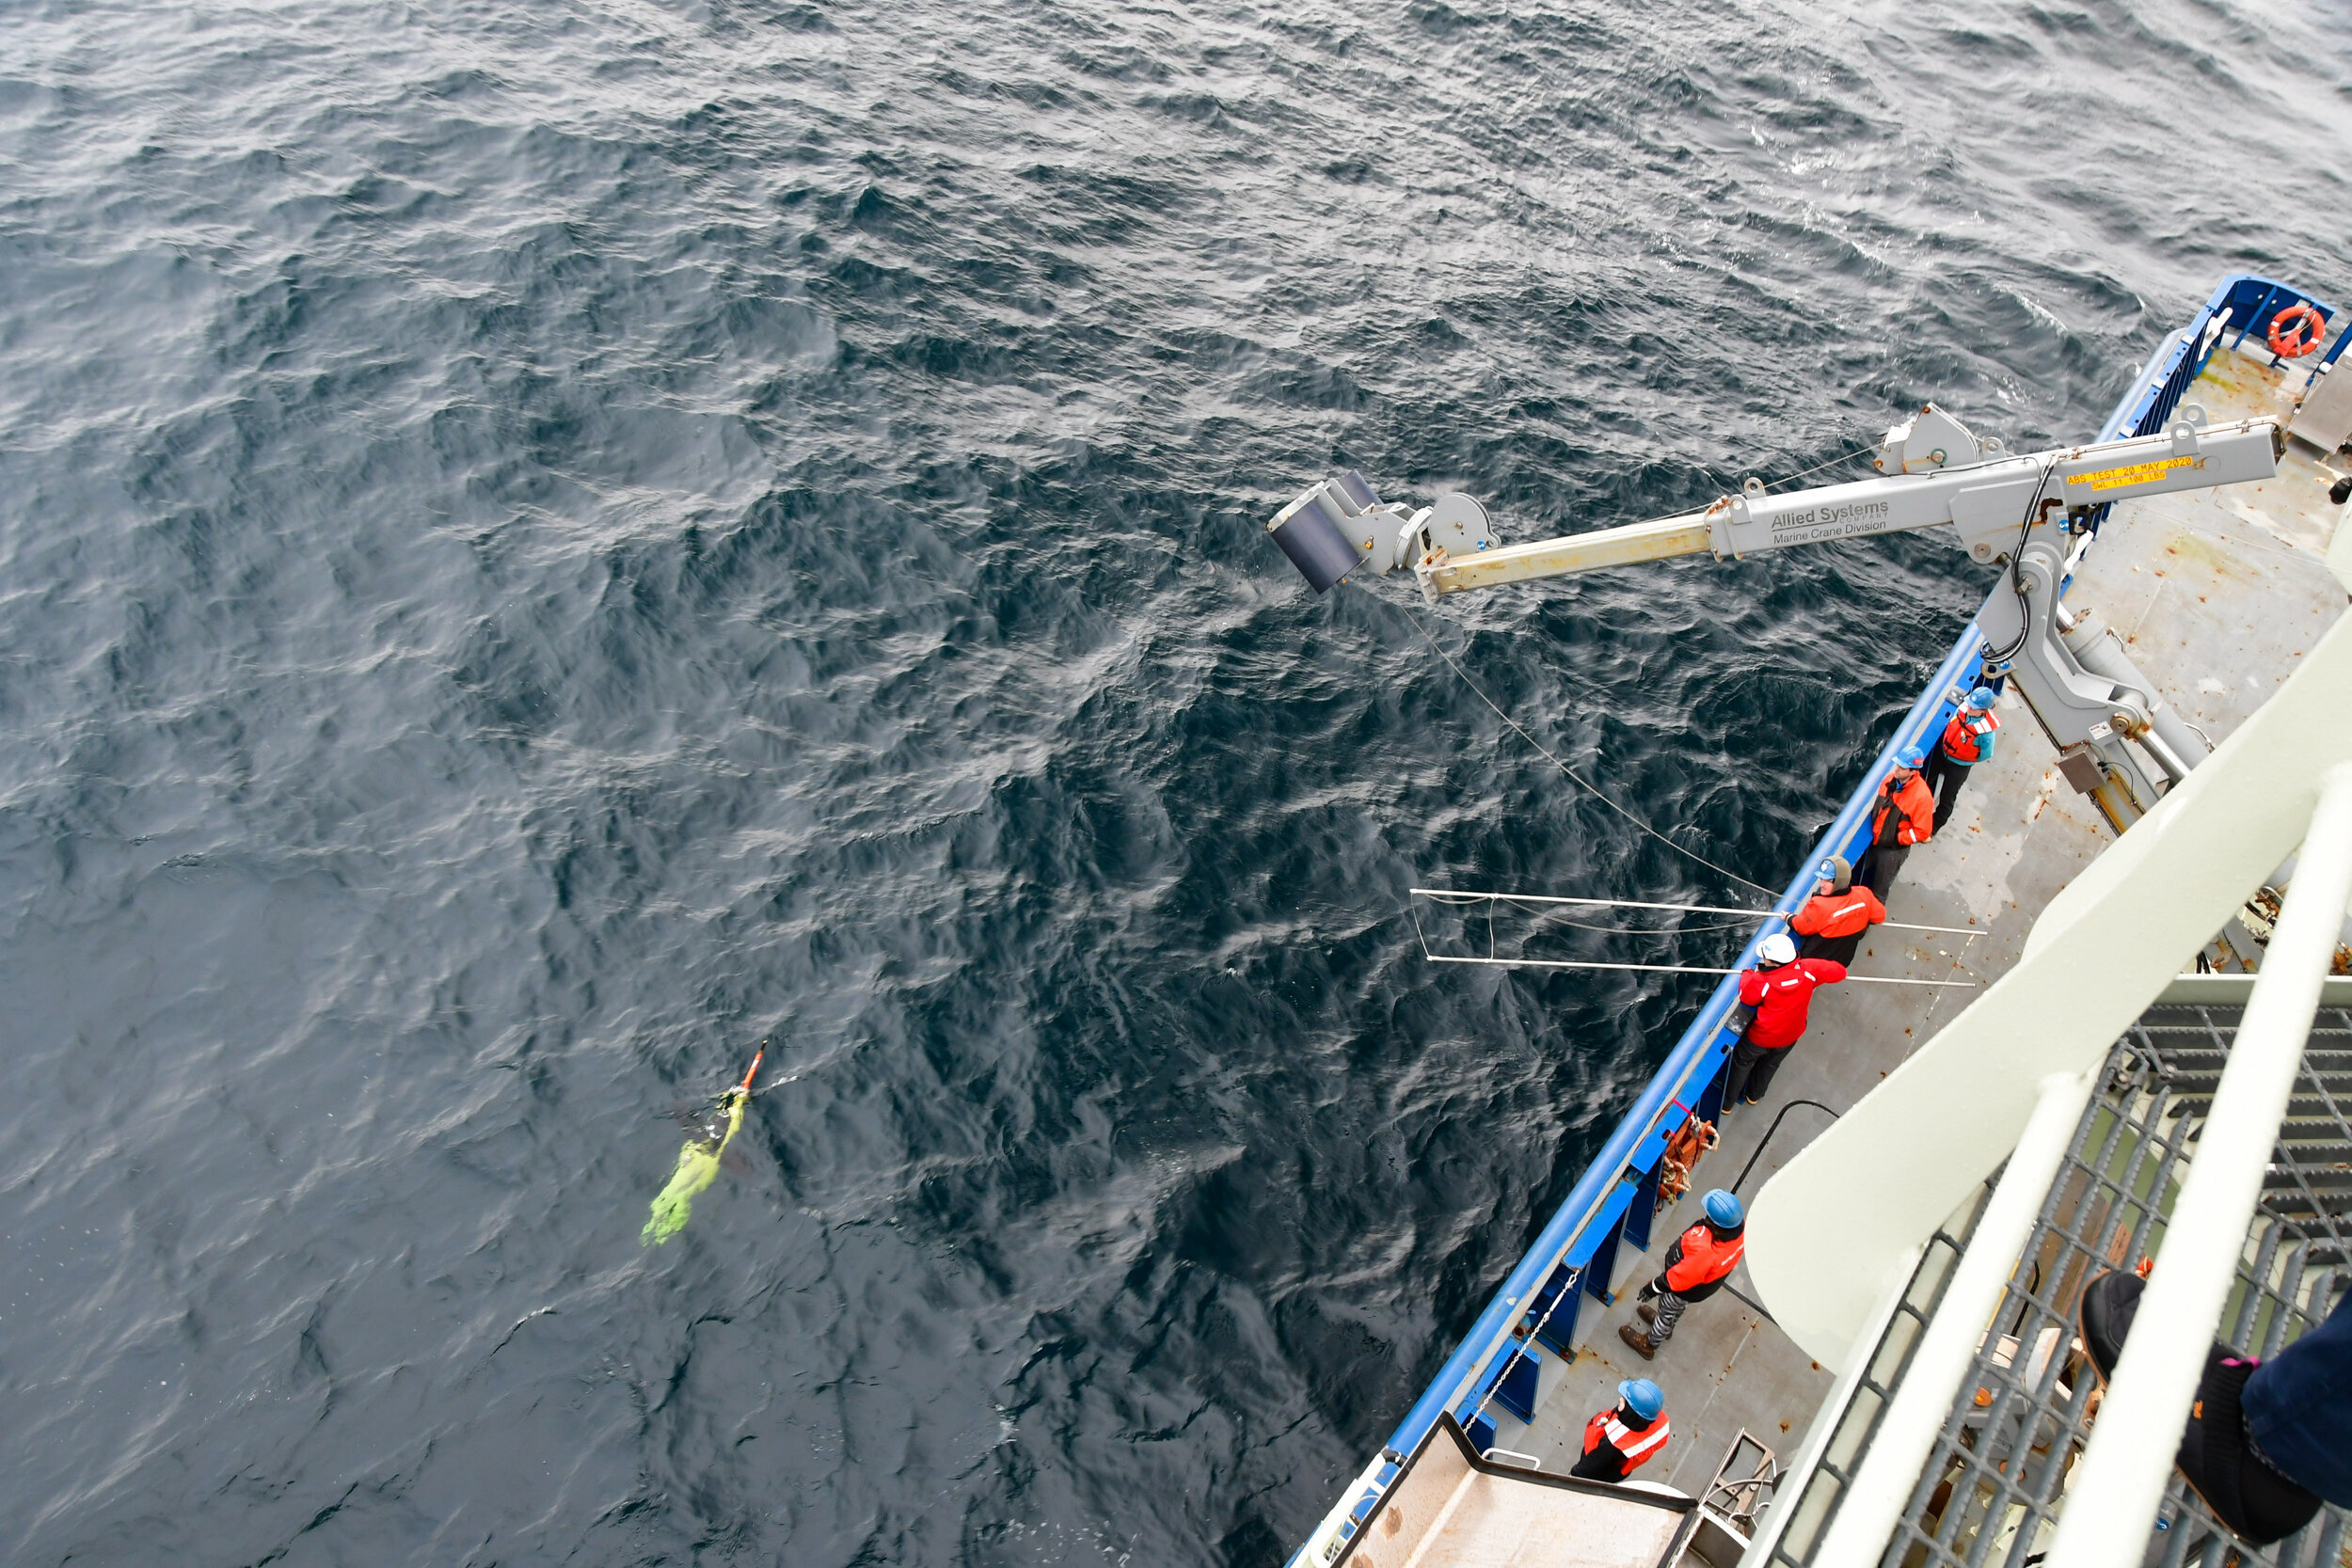
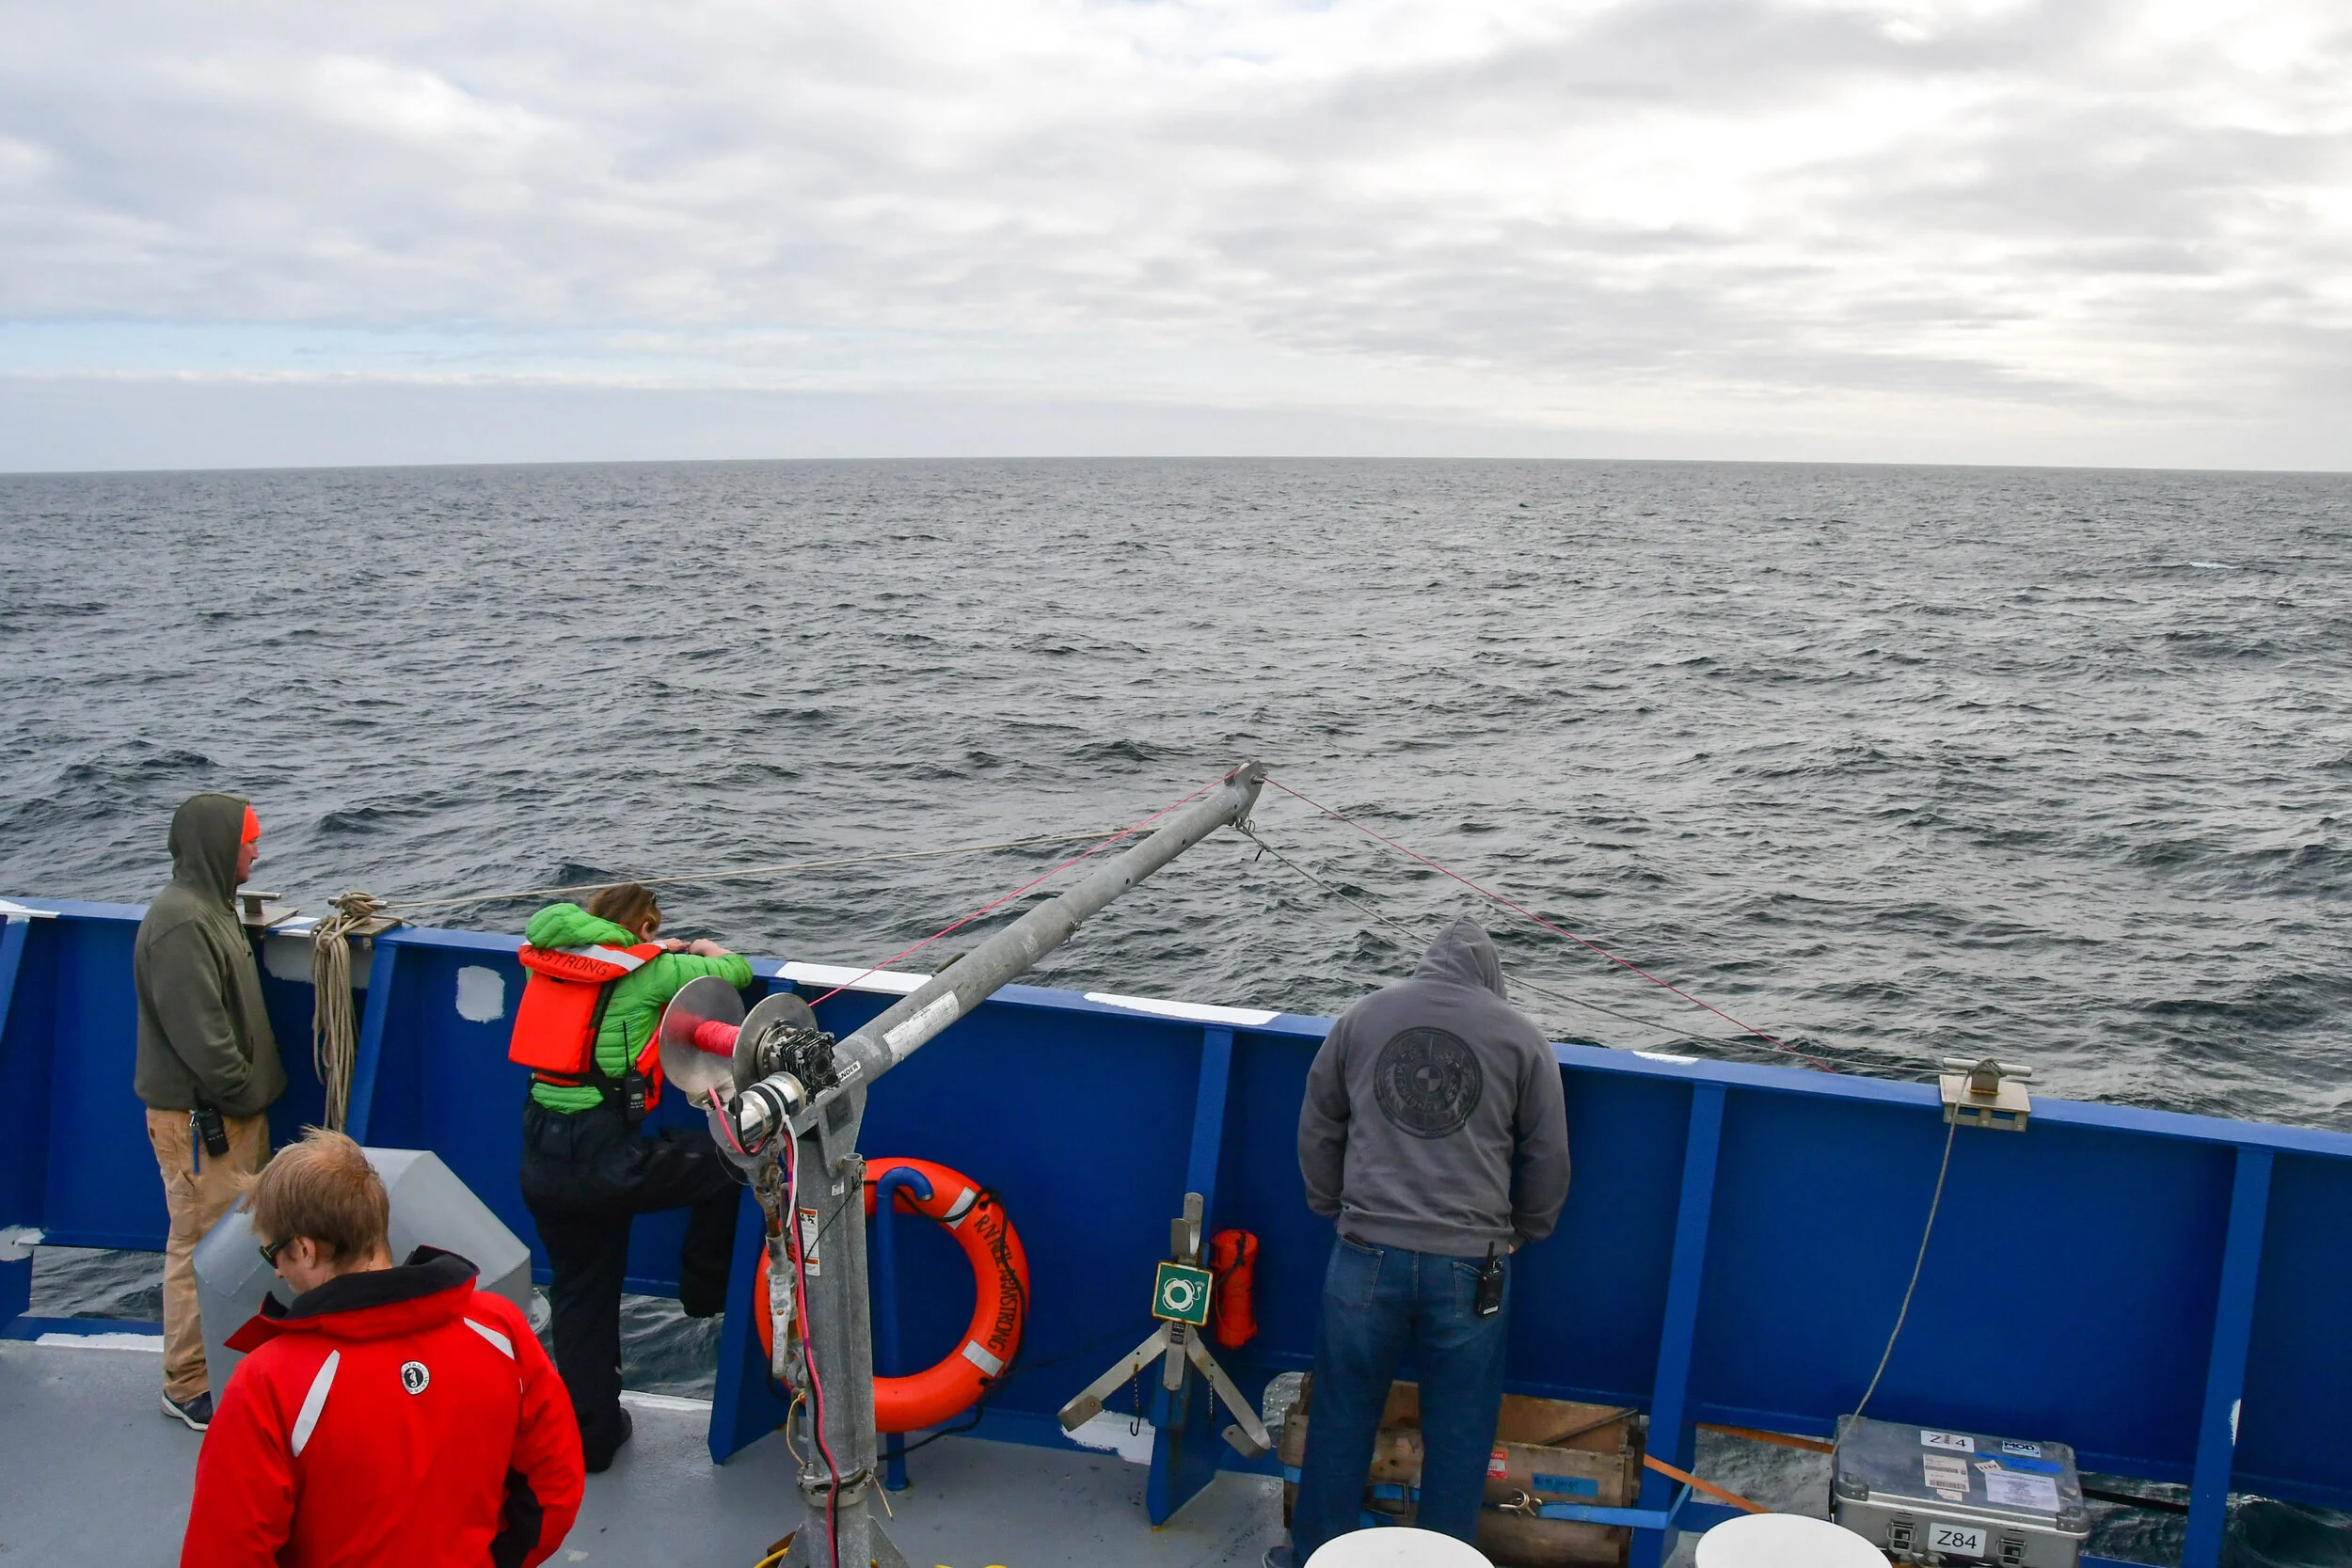
Recovering a sea glider.
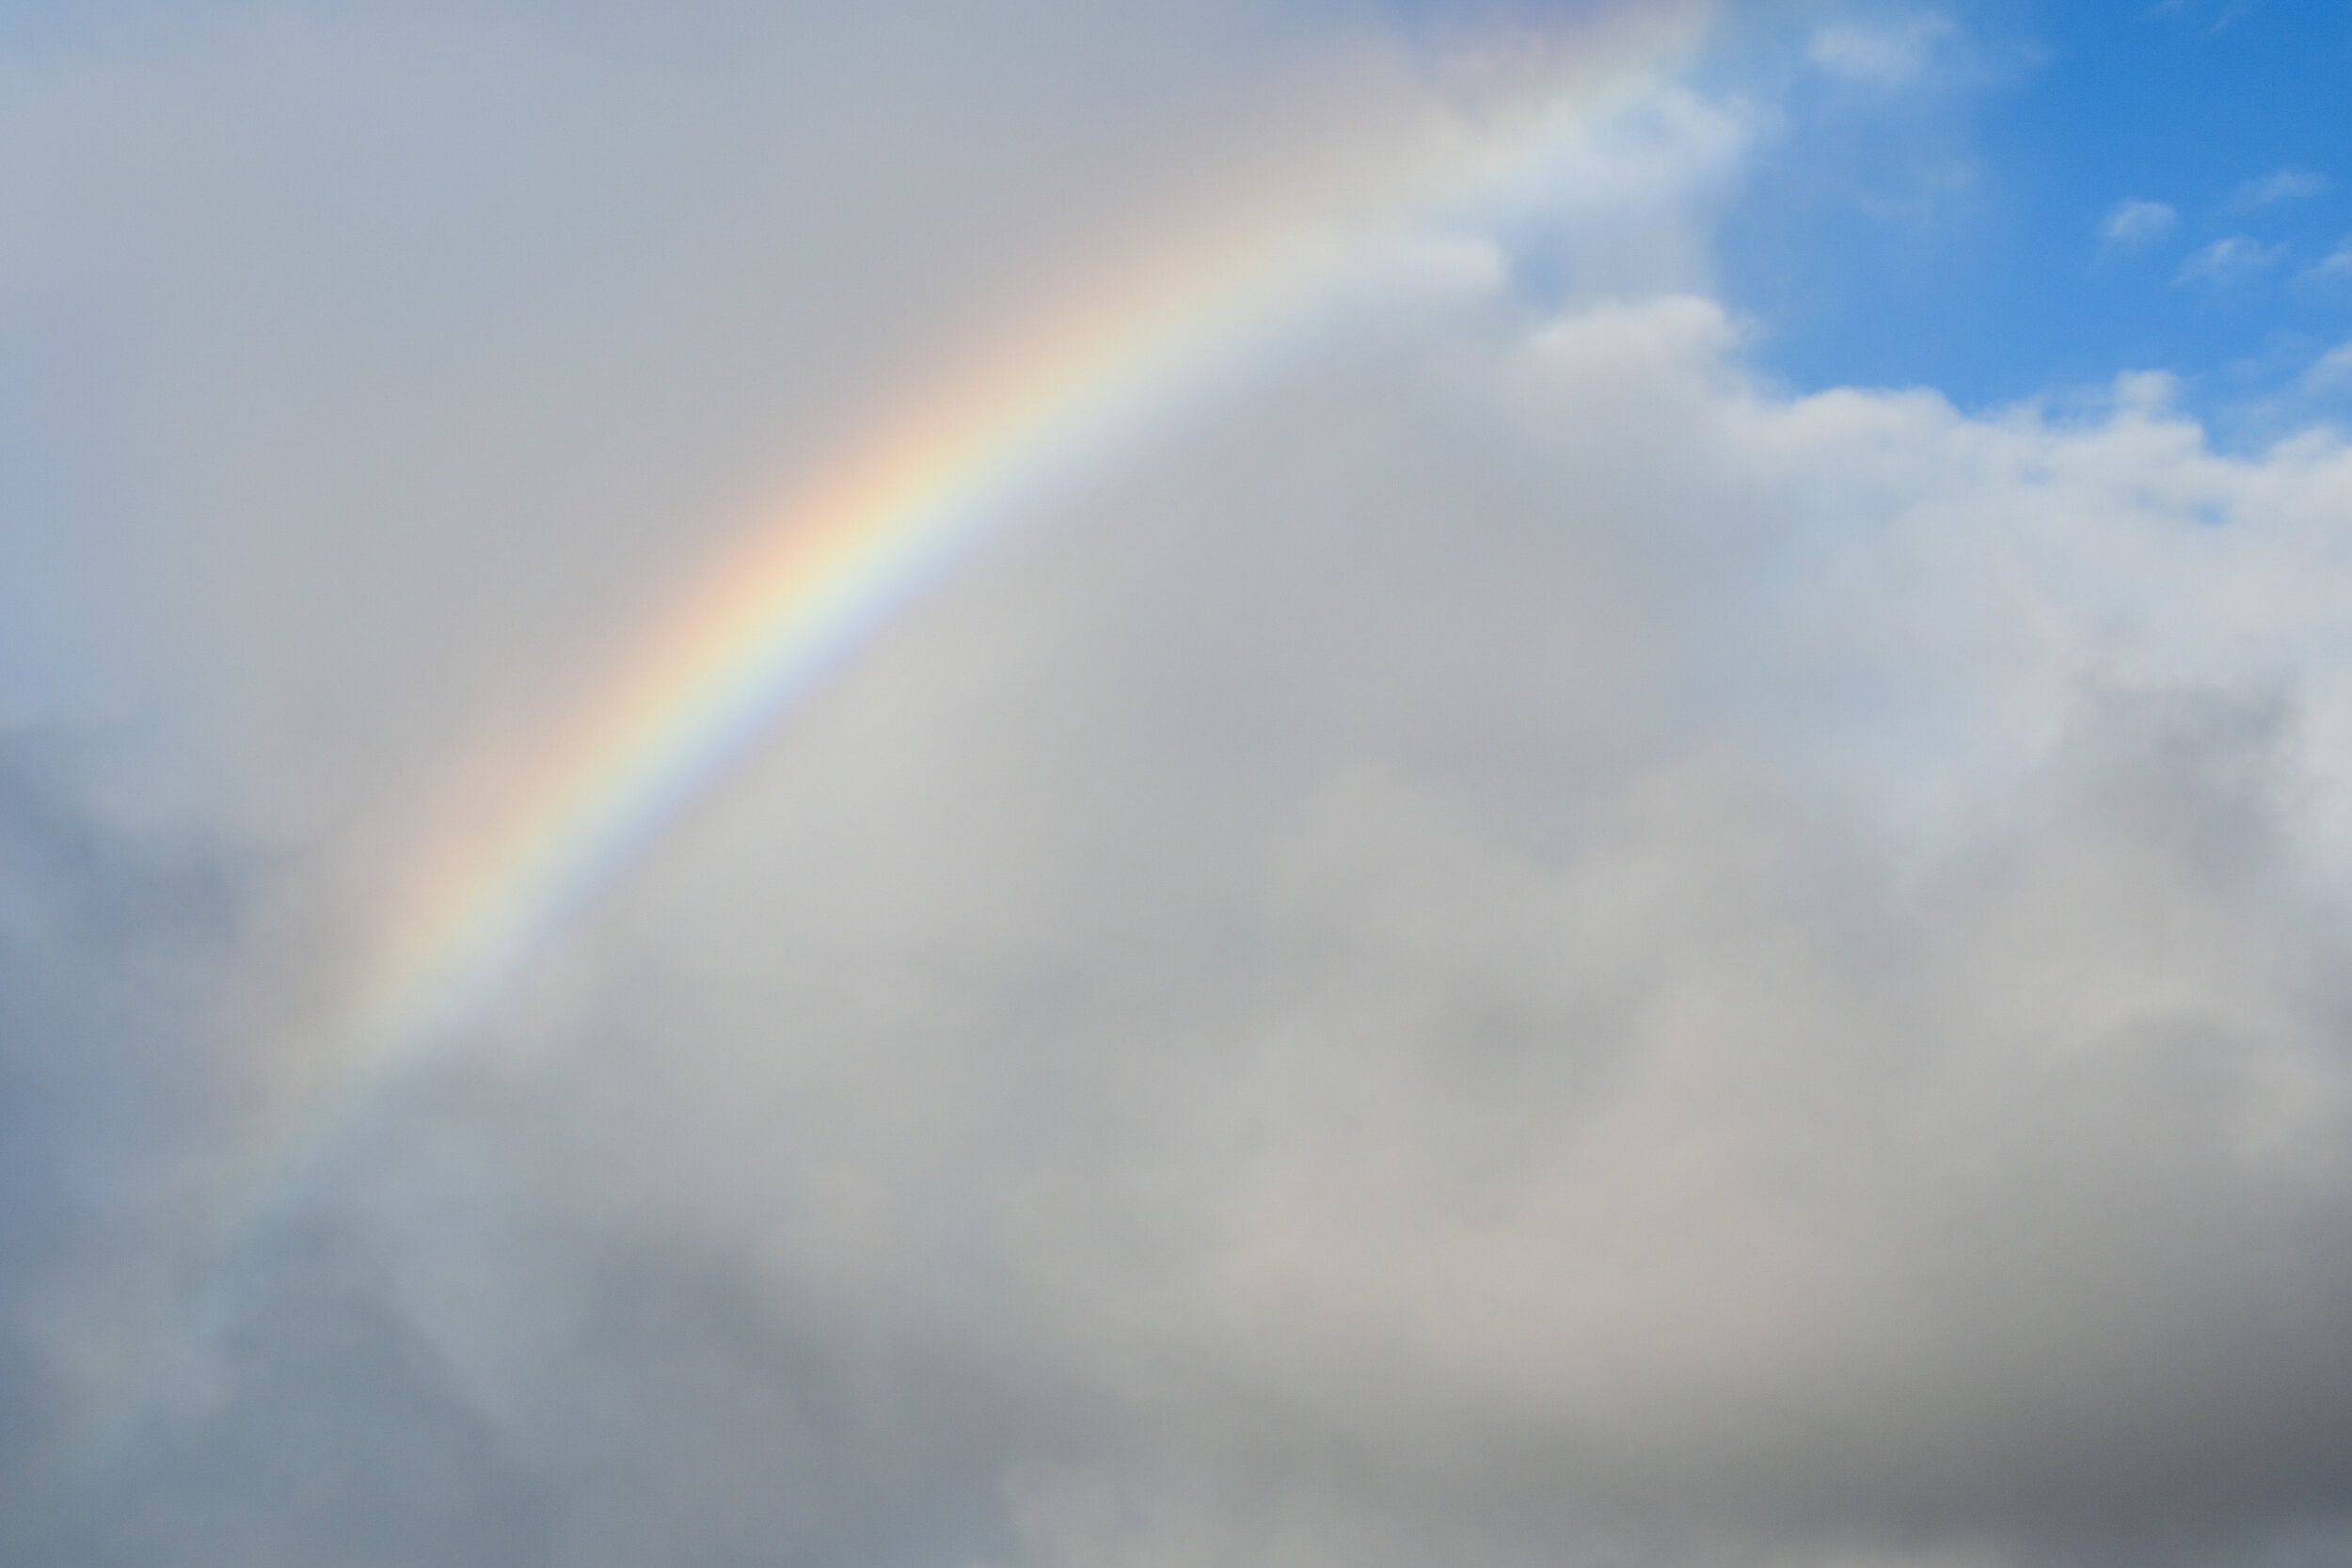
Last week a bit of nasty weather (30ft waves and 50 knot winds…) had us holed up behind Jan Mayen for a few days. But the spirits remained high onboard. We caught up on sleep, watched some movies and had a few dance sessions in the lab. We also celebrated two birthdays (MOD’s own Ale among them) with plenty of delicious cake, colorful balloons and origami dinosaurs, because that’s the proper way to do it on a ship. When things cleared up we were greeted by both sunrises and rainbows.

This week involved more uCTD-ing and bow-chaining, more than one big wave that made the ship roll enough to have things flying around the lab, and a few slightly panicky moments for some of us as the internet access went down just when we tried to submit abstracts to Ocean Sciences (thankfully the satellites decided to come back in time). More than one instrument has also started acting up a little after almost five weeks at sea, but thanks to a wonderful, resourceful and talented science party and Armstrong crew things have been surprisingly smooth (everything but the waves that is) and full of laughter, and we will be coming home with some really cool data. It will be put to good use in shaping the NORSE project's next few steps and to develop the sampling plan for next year’s cruise that is scheduled to take place in the same region in the fall of 2022.
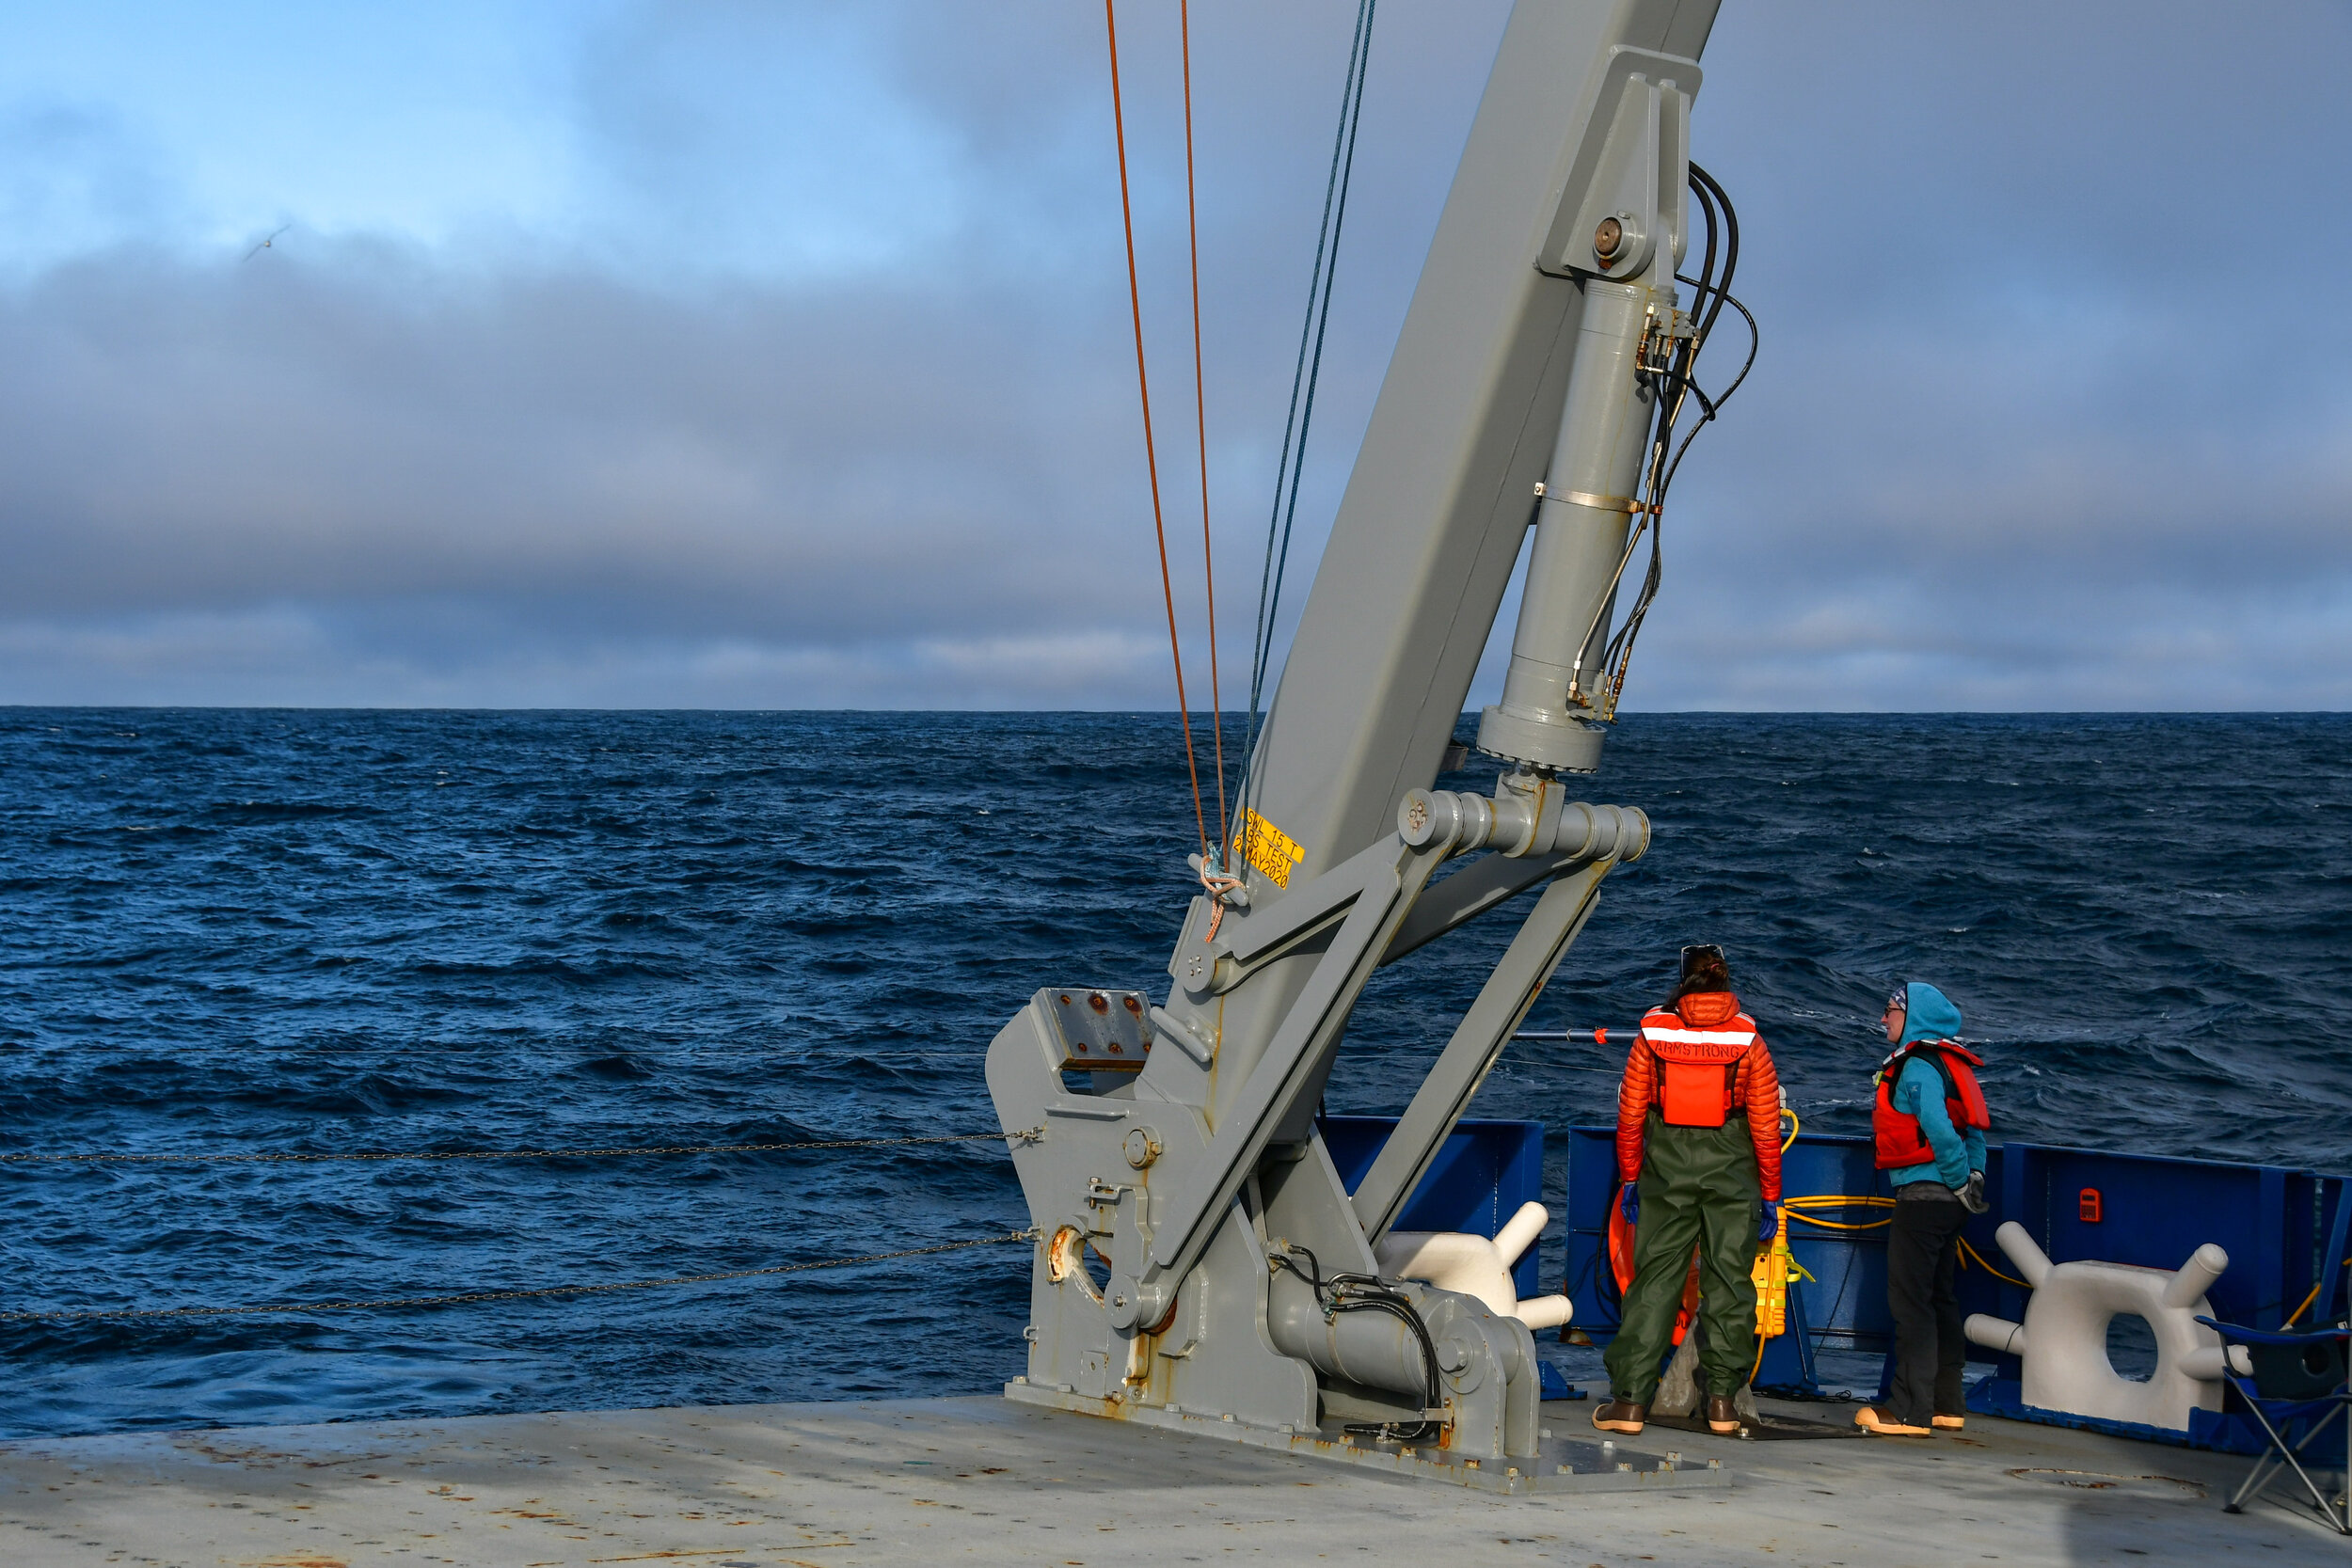
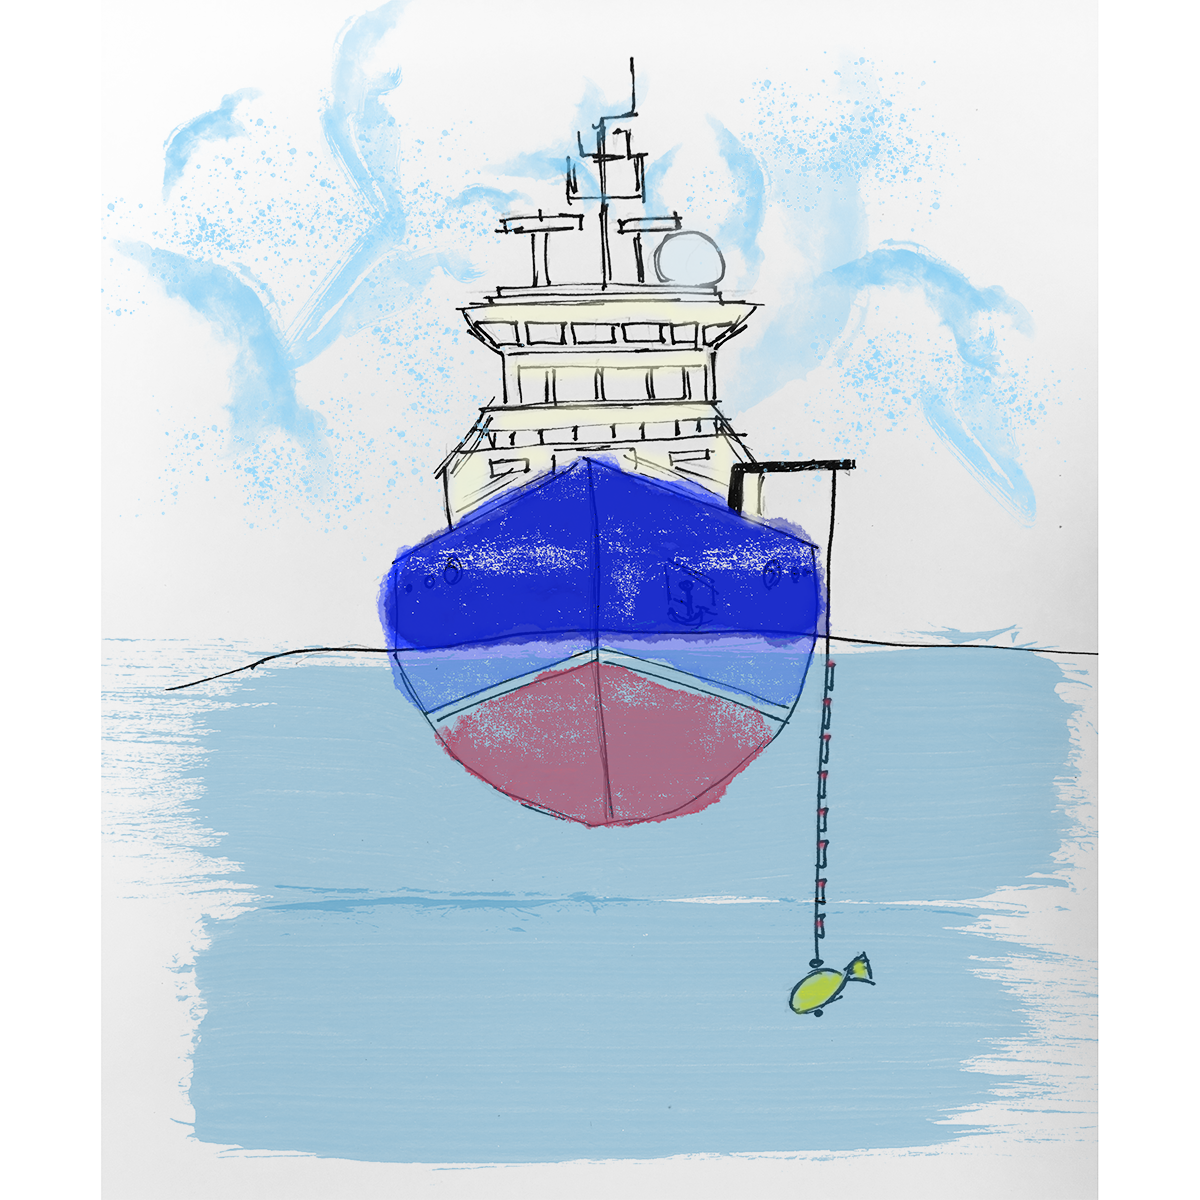
uCTDing in nice weather is not too bad… (Don’t worry, we’ve done plenty of sessions in the dark with cold rain and big waves washing over the back deck too.)
A massive thank you goes out to the fenomenal crew aboard the Armstrong who’s skill and good humor in putting up with our ever changing plans and ideas (like going back up and down the same 6nm transect at 2 knots three times in a row while uCTDing to investigate a peculiar wiggle we spotted at the base of the mixed layer) has been crucial to the success of this cruise. Another massive thank you to all the collaborators and colleagues back on land supporting us with everything from packing and loading, setting up and trouble shooting instruments, context data and moral support.
We have another day or so of work out here and then it’s a-boat time to head back to Reykjavik and sail-abrate a successful five weeks at sea. We’ve done a lot of great science, seas-ed many a day, and have many a good story to tell (fear not, they all have ferry-tail endings).

The NORSE pilot science crew in front of Jan Mayen, left to right: Dave Morton, Kerstin Bergentz, Allison Ho, Alejandra Sanchez-Rios, Laura Crews, Justin Burnett, Luc Rainville, Laur Ferris, Anna Savage, Raymond Young, Sam Brenner, Angel Ruiz-Angulo - a true dream team!
Signing off for this time with a final picture of the science party of the NORSE pilot 2021.
Over and out!
Text and photos by Kerstin Bergentz