NORSE pilot cruise - we're off!

Ahoy from the North Atlantic!
The NORSE (Northern Ocean Rapid Surface Evolution) pilot cruise team have just set out on a five week journey around the North Sea. We have all sorts of exciting toys with us, from different gliders and floats to a selection of drifters, a bow chain and a few acoustic instruments.

Half of the science party. Left to right: Kerstin Bergentz, Alejandra Sanschez-Rios, Laura Crews, Anna Savage, Allison Ho and Laur Ferris.

Half of the science party. Left to right: Kerstin Bergentz, Alejandra Sanschez-Rios, Laura Crews, Anna Savage, Allison Ho and Laur Ferris.

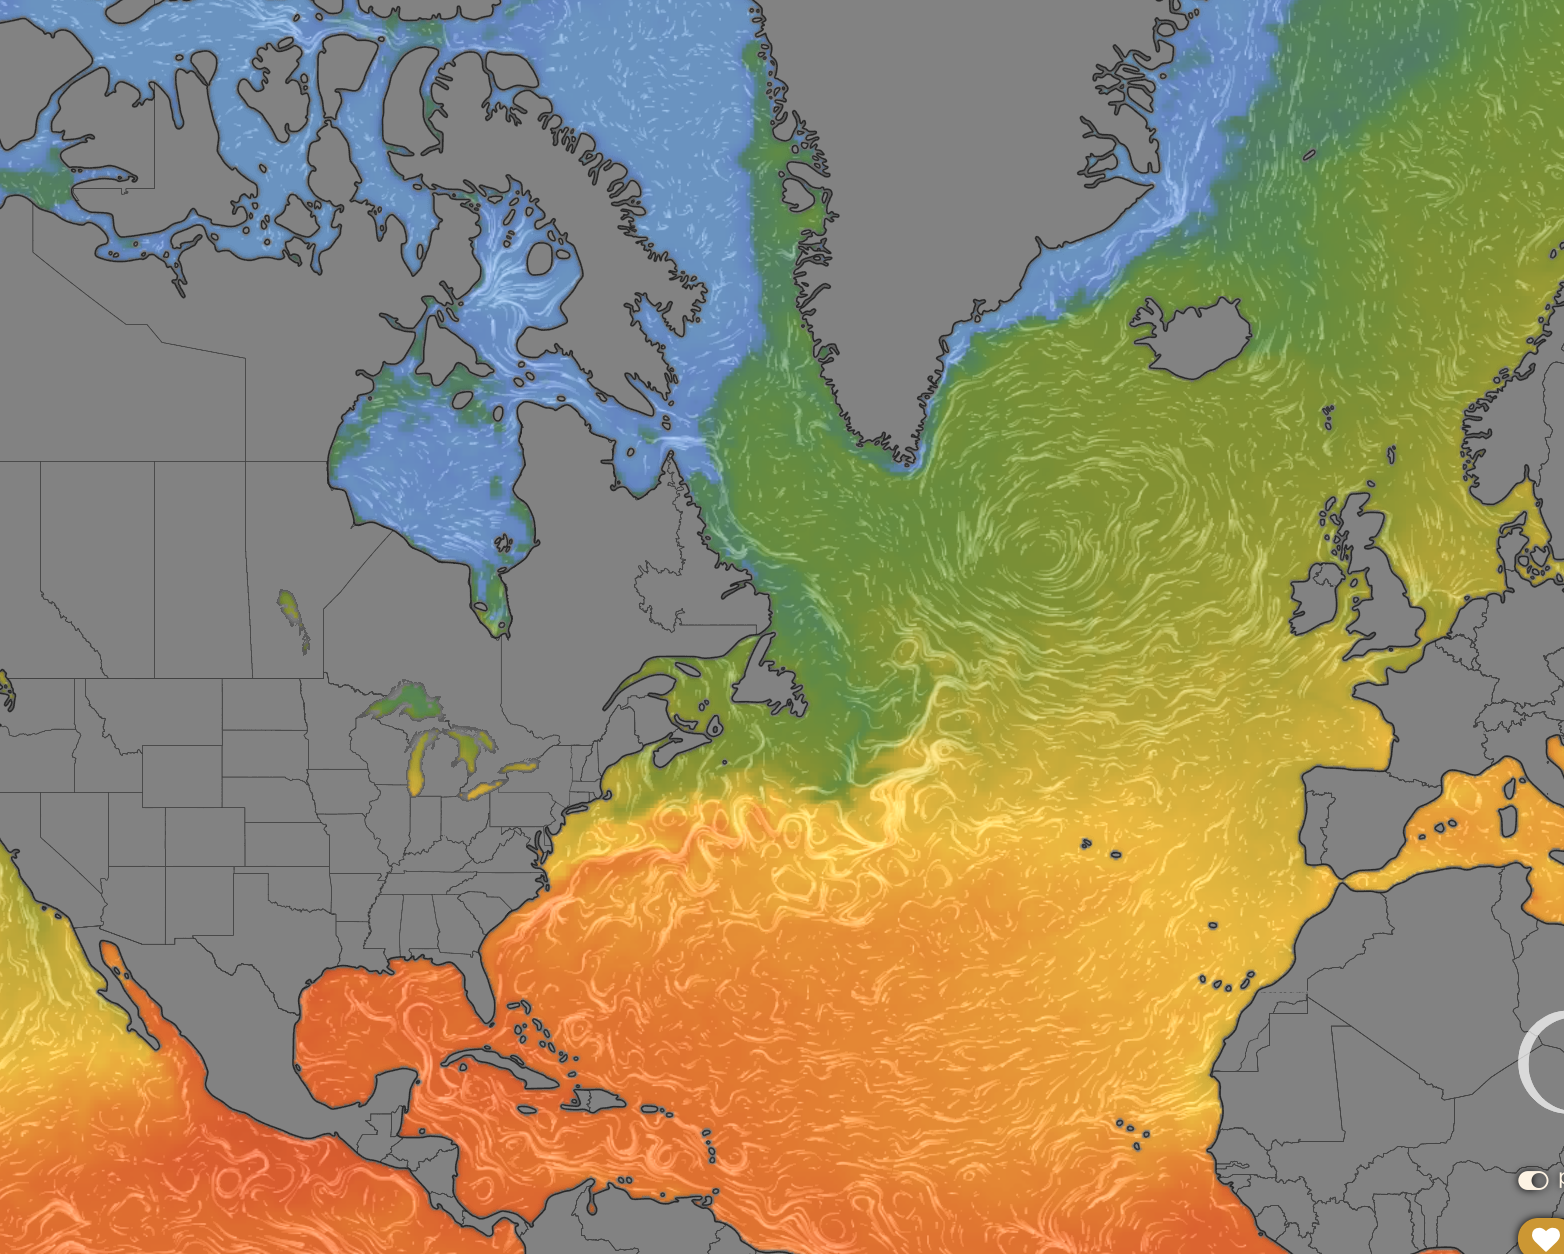
The last few days have been spent unpacking and strapping things down, making sure that the R/V Neil Armstrong is ready to tackle whatever conditions the weather gods decide to throw at us, and this morning, with the clouds hanging low (mixed in with some volcanic smoke!) and the ocean being relatively flat, we left Reykjavik and headed down, coming round south of Iceland trying to minimize the risk of having to deal with ice (compared to heading north).

We’ll have about a 3 day transit time to get close to the Lofoten eddy where we’ll start putting instruments in the water. The time until then will be spent setting up and preparing equipment and getting our sea legs on.

The MOD members onboard (Anna, Ale and Kerstin) have high hopes for the bow chain which we’ve spent a good deal of time triple taping about 25 Solo temperature probes and 4 Concerto ctd probes on (yes, that is a loooot of tape…)

We’ll be back with updates on our scientific endeavors and hopefully some fun stories from higher latitudes.

In the meanwhile, here’s the nautical joke of the day:

Q: Why do seagulls fly over the sea?
A: Because if they flew over the bay, they’d be bagels!

DSC_8210.jpg

Text and photos by Kerstin Bergentz

A new way of measuring microstructure

This whole project is called the Boundary Layer Turbulence experiment, a name which might provoke the question, “How do we actually measure turbulence in the ocean?” Generally, the tried-and-true way is to use tiny sensing elements called piezoelectric beams. These output a voltage when they are deflected, just like the needle on a record player. We deploy them on torpedo-shaped instruments that descend slowly through the water. When the vehicle descends through turbulent water, the beams get deflected by the flow moving back and forth.

(Most of) our 30 hour timeseries in the lower 400 m of the ocean at the location shown in the map. Colors show the quantity epsilon in logarithmic units. Epsilon is a measure of ocean turbulence - it quantifies the dissipation of turbulent kinetic energy. Black contours show temperature.

(Most of) our 30 hour timeseries in the lower 400 m of the ocean at the location shown in the map. Colors show the quantity epsilon in logarithmic units. Epsilon is a measure of ocean turbulence - it quantifies the dissipation of turbulent kinetic energy. Black contours show temperature.

Turbulence in the deep ocean evolves incredibly rapidly.  Here is a figure of turbulence and temperature data we collected over a 30 hour time period. As the tide causes flow up the canyon beneath us (at hour 23:00), you can see the temperature layers (black contours) rising. Colder water from the deeper part of the canyon is moving along the canyon floor into shallower depths and displacing the water above it.  As time goes on, the displaced water reaches a point just like a breaking wave on the beach, where it breaks.  A 200-m wave (20 stories high) is breaking, 2 km beneath the sea!  At that point, very strong turbulence starts (orange/red colors). With the next swoosh of the tide a similar thing happens with temperature surfaces rising and breaking, but this time it looks a little different - we sampled this flow for 2-1/2 tidal cycle and you can see how complex things are!

To resolve the rapidly changing turbulent environment of the bottom boundary layer, we want to sample it as fast as humanly possible. When we profile between the seafloor and 400 m off the bottom every 13 minutes as we have been, we can see the turbulent flows evolving. This allows us to make a pretty picture as shown but more importantly it gives us insight into the structures that arise from turbulence and their effects on the ocean circulation - which is our main goal.  We learned from the dye and our profiling mooring (previous posts) that water is moving up the canyon - and this turbulence is what allows it to happen. We seek to understand the details, and that requires densely sampled, precise measurements.

Our new “epsi-fish” profiler has several new innovations that make such rapid sampling of the deepest layers of the ocean possible.  First, we deploy the instrument from a long boom off the aft quarter of the ship, on a 3000-m slack data cable rolled up on our winch.  By keeping the instrument well away from the ship’s propellers, we can sample while keeping the ship in one place. This may seem trivial, but being able to dynamically position the ship to stay in the same place while profiling is a big deal. Without our long boom, the ship would have to steam away slowly while paying out cable, so the instrument stays safely behind the ship.  This would require more cable, and profiles would take longer because the cable would need to be hauled back in.  Plus, the ship would need to periodically turn to stay in the same place.  Staying in one place saves lots of time and keeps our profiles closely spaced in time.

MOD engineer Sara Goheen recovering Epsifish after a deployment. Here you can see the chute is in its "popped" position. Photo credit: San Nguyen

MOD engineer Sara Goheen recovering Epsifish after a deployment. Here you can see the chute is in its "popped" position. Photo credit: San Nguyen

The second ingredient for fast profiling is a “pop the chute” mechanism.  Most profilers fall slowly all the way down, which is great for measuring turbulence all the way down, but in this experiment we mostly care about the bottom few hundred meters. We don’t want to wait the long time, about 45 minutes, that it would take to slowly go from the surface to the bottom and back.  Instead, we “skydive” down quickly with our drag screens clamped at the instrument’s sides, then deploy them with a command from the surface that triggers a servo actuator, releasing the chute and allowing us then to repeatedly profile the bottom 400 m every 13 minutes.

A third key enabling technology is a precise encoder on our sheave or pulley at the end of the boom which pulls the line steadily off the winch drum.  (The block in itself is a thing of great beauty, which is counterbalanced and has enough degrees of freedom to move with the ship and the seas without chafing the cable.  And for that matter, the completely electric direct-drive winch is another innovation that allows thousands of profiles to be taken at high speed with little service owing to its small number of moving parts relative to a hydraulic or geared winch). By carefully counting turns of the sheave, we know exactly how much line is out and can match that to the measured depth of the profiler.  Knowing how much line we have out is important for two reasons: paying out too much cable can create loops that can get tangled, possibly resulting in knots that if pulled through the sheave can cut the line and lose the instrument.  Second, the instrument detects the seafloor with an altimeter, allowing us to approach within 10 m of the bottom.  However, too much line out can cause the vehicle to hit the seafloor since all the slack must be hauled in before the vehicle begins to rise.

Our final bit of kit, humble as it may sound, is a “crash guard” for protecting the probes in the event of a bottom impact (the author was driving the winch just tonight when said crash guard was put to the test).  In essence a ring slightly proud of the probes, computational fluid dynamics (CFD) modeling was done to ensure that turbulence from the crash guard would not impact the sensitive readings from the shear probes.

Steve Woodward hooking Epsifish to bring it safely back on board. 

Steve Woodward hooking Epsifish to bring it safely back on board. 

All of these pieces together took a huge amount of work by our engineers to develop in the last two years, but have made for a wonderfully successful operation during our long time at sea this summer. We are excited to use these tools in many experiments to come.

Boundary Layer Turbulence - the experiment begins!

To prepare for our exciting Boundary Layer Turbulence Experiment (follow along with the cruise blog) our team has been working around the clock to prepare three different tools for the experiment:

  1. Moorings that, together with instruments from Kurt Polzin at Woods Hole, will measure the turbulence and mixing of cooler water with the warmer water above. These required the usual attention to detail and care in packing and planning each element. Beyond that, we are adding a new element for this experiment: one of our profiling moorings will have an epsi to make turbulence measurements.

  2. We’ll be needing to sample the dye cloud we release near the sea floor as fast as possible. So we have added a fluorometer to our fast CTD. Because the fast CTD rises and falls so fast and samples on both up and down casts, we’ll be able to sample the dye cloud up to 5 times faster than we would by using the standard ship’s CTD rosette.

  3. We’ve made huge changes and improvements to the electronics, software and body of our beloved epsi profiler. Many of the electronics and software changes are invisible, but they greatly increase the reliability and usability of the system. The mechanical changes are more visible and more crucial for the BLT experiment, which only focuses on the bottom few hundred meters of a 2000-m-deep ocean. So we have: i) added a longer, 3000-m cable, to allow us to sample deeper; ii) designed a cool new facility for pressure testing all of our sensors to ensure they don’t have odd effects at depth; iii) completely rebuilt the instrument to be heavier and longer which will make it more sensitive and better at reaching the great depths; and iv) contrary to most microstructure profilers which simply fall slowly the entire way to the bottom like parachuters, epsi now has the ability to “skydive” wherein it keeps its drag screens retracted until receiving a command from above, at which time it “pops the chute” and falls slowly in the lower part of the water column which we care about. With an altimeter, We’ve tested and retested all of these features for months and months in the lab, on the R/V Beyster, and in the 10-m pool at our lab, and think we are ready to go. Indeed, our initial tests yesterday looked great.

Wish us luck - we’re doing new things with new tools and are excited.

The latest and greatest epsi profiler getting assembled in the lab.

The latest and greatest epsi profiler getting assembled in the lab.

Drawing of epsi diving quickly to depth and then popping its chute to take measurements close to the ocean floor.

Drawing of epsi diving quickly to depth and then popping its chute to take measurements close to the ocean floor.

Ready.....set.......

Though there have been some (substantial) fieldwork efforts going on here and there during this last pandemic year, like most of the world most of us have been stuck closer to home. With things stabilizing a bit (at least in the US) we are starting up again with our normal level of crazy :) Heading out in June are two fun and hopefully exciting projects in two very different parts of the world, looking at quite different things.

  • The Boundary Layer Turbulence project will take place in the far North Atlantic. The MOD team and colleagues from several other universities will be delving into the deep dark ocean with some new tools, to see what processes turbulently mix water at the very bottom of the sea, where the ocean rubs on the seafloor. Spoiler alert - those ethereal lurking mysteries may hold a clue for how the whole ocean overturns. Stay tuned for more from them as they set sail soon.

  • Half a world away, the SUNRISE project will take place in the sweltering Gulf of Mexico. This one is looking at surface processes, specifically how strong fronts associated with Mississippi and other river outflows interact with wind-driven oscillations in the surface ocean, and how they conspire to move heat, salt and nutrients around the coastal ocean.

Stay tuned for dueling updates!!

blt_sunrise1.png

Pelicans gliding on ocean waves

MOD researchers Ian Stokes and Drew Lucas have recently developed a theoretical model that describes how the ocean, the wind, and the birds in flight interact in a recent paper in Movement Ecology. They found that pelicans can completely offset the energy they expend in flight by exploiting wind updrafts generated by waves through what is known as wave-slope soaring.

Photos by Simone Staff

In short, by practicing this behavior, seabirds take advantage of winds generated by breaking waves to stay aloft. Wave-slope soaring is just one of the many behaviors in seabirds that take advantage of the energy in their environment. By tapping into these predictable patterns, the birds are able to forage, travel, and find mates more effectively. “As we appreciate their mastery of the fluid, ever-changing ocean environment, we gain insight into the fundamental physics that shape our world,” said Lucas.

For more information, visit
https://jacobsschool.ucsd.edu/news/release/3261

Congratulations to our new PhD's

Congratulations to Drs. André Palóczy and Kristin Zeiden for completion of their PhDs.

In September of 2020, André Palóczy defended his thesis on the turbulence and cross-slope transport off Antarctica and California. Dr. Palóczy, co-advised by Jen MacKinnon, Sarah Gille and Julie McLean, combined modelling and field approaches in order to answer these compelling and complicated dynamics. This included being Chief Scientist on the R/V Sproul during the 2017 Inner Shelf DRI.

In February of 2021, Kristin Zeiden, co-advised by Jen MacKinnon and Dan Rudnick, completed her thesis on the broadband, multi-scale vorticity wake generated by flow past Palau. Dr. Zeiden used a combination of glider, mooring and drifter data to explore how small-medium scale eddies shed from the tip of Palau, by a combination of mean and tidal flow, combine and conspire to create a large-scale island wake.

We wish both André and Kristin the best of luck starting their new positions — André as postdoc in Norway in 2021 with Joe La Casce and Kristin as a postdoc at UW/APL with Jim Thomson. We will miss them!

Drs. Kristin Zeiden and Andre Paloczy charting their bright futures.

Debuting our new towed Phased Array Doppler Sonar

Engineers Jonathan  Ladner,  Riley Baird  and  Sara  Goheen are excited about the new instrument!

Engineers Jonathan Ladner, Riley Baird and Sara Goheen are excited about the new instrument!

Though this year has been hard and different in so very many ways, one small up-side from the reduced fieldwork has been the opportunity to make progress with some new development projects. Building off of previous pioneering advances of Rob Pinkel, Jerry Smith and Mike Goldin, the group has been hard at work designing and building a new phased array. Normally, ‘Doppler Sonars’ in the ocean are mounted on a ship or moored, and measure a profile of ocean currents in one direction, by sending out acoustic signals, looking for the doppler shift of the reflected response from moving currents (think sound of passing trains), and range-gating the results to get a measure of ocean currents as a function, say , of depth below a ship. As a ship drives around, that allows us to map out ocean currents in two dimensions (depth below ship, and along the ship track). With a phased array, beams can be formed in multiple directions, allowing us to see a ‘wedge’ of ocean currents, not just a single profile. The hope of this new instrument is that if we tow a phased array behind a ship, it can map out volumes of near-synoptic ocean currents, which will let us better understand the complex and rapidly evolving structures of turbulence, submesoscale instabilities, frontal dynamics, and more! Last week the team headed out on the R/V Sproul and did some debut towing and testing of our new vehicle.

MOD scientists in Ghana

Every August since 2015, oceanographers from around the world board flights bound for Kotoka International Airport in Accra, Ghana. Upon arrival, these scientists meet up with Dr. Brian Arbic, from University of Michigan, and local oceanography faculty at the University of Ghana to host a summer school aimed at strengthening the West African involvement in global oceanographic research.  

This August, however, in the midst of the COVID-19 pandemic, Anna Savage and Drew Lucas logged in to a Zoom meeting scheduled for 3 PM Accra time (8 AM California time, which was, admittedly, a little early for Anna) and watched the participant count increase from 6 to around 50. This year, as with everything, the entirety of the oceanography summer school was transitioned to operate remotely. Through a mix of Zoom meetings, pre-recorded YouTube videos (such as Anna’s), and a collection of well organized Slack channels, instructors were able to interact with the over 250 participants over the five day event, covering topics from ocean acidification to remote sensing to the obstacles of women in STEM fields. The asynchronous lectures, hosted on YouTube and linked both in Slack and on the summer school’s website (coessing.org), were accessible to participants throughout the week, while the lecturers also hosted virtual office hours. This combination of scheduled “face-to-face” office hours and pre-recorded content provided the participants the opportunity to interact with instructors in real-time, building a sense of community, while still allowing participants to attend the summer school on their own time, something that is increasingly important as we all continue to work from home.

While the community of instructors looks forward to being in Ghana again next year, there is value in these exercises in distance learning, even when that distance spans oceans. The importance of in-person meetings is undeniable and yet, the relationships amongst the participants and instructors are built on respect and communication, not solely on proximity.

coessing.jpg

MOD students design and execute a novel kelp turbulence experiment - in a pandemic

A student-designed project to measure the flow around the Point Loma Kelp Forest kicked off this week with the successful deployment of an Acoustic Doppler Current Profiler (ADCP) within the kelp forest. The project was designed by MOD graduate students Bethan, Alex, and Noel, along with fellow graduate student Manuel Gutierrez-Villanueva, for a proposal writing and experiment design class taught by MOD PI Matthew Alford and SIO professor Uwe Send. The project investigates how the presence of vegetation affects coastal flow and the rates of turbulent dissipation outside the kelp forest and within its interior. 

Through the support of UC SHIP Funds and the SIO Scientific Diving Program, operations will continue over the coming weeks with ship surveys aboard the R/V Robert Gordon Sproul to measure ocean velocity, and small-boat operations to collect the first-ever microstructure measurements within a kelp forest using the recently-upgraded epsi-fish, our microstructure profiler. The results of this project will help us understand how physical processes, important for the exchange of nutrients and spores, interact with the Point Loma Kelp Forest, the largest giant kelp bed in Southern California and home to many invertebrates, fishes, and marine mammals.

MOD graduate student and scientific diver Alex Andriatis (right) with fellow grad student Anela Akiona (left) after a successful ADCP deployment in the Point Loma Kelp Forest.  Thanks to Jennifer MacKinnon and Amy Waterhouse for loaning the ADCP, an…

MOD graduate student and scientific diver Alex Andriatis (right) with fellow grad student Anela Akiona (left) after a successful ADCP deployment in the Point Loma Kelp Forest. Thanks to Jennifer MacKinnon and Amy Waterhouse for loaning the ADCP, and to Tyler Hughen and Paul Chua for assisting in preparing it.

We expect four different physical regimes to exist in the area surrounding the Point Loma kelp forest (detailed in left column). To observe and understand their dynamics, we designed ship transects (pink dotted lines), ADCP deployments (re…

We expect four different physical regimes to exist in the area surrounding the Point Loma kelp forest (detailed in left column). To observe and understand their dynamics, we designed ship transects (pink dotted lines), ADCP deployments (red triangles), and microstructure sampling stations (purple stars) around the forest’s boundaries.

Congratulations to our new PhD's

The MOD group has produced two new PhDs!

It was this past September that Madeleine Hamann defended her dissertation titled “The dynamics of internal tides and mixing in coastal systems”, chaired by Matthew Alford. Maddie continues to work at Scripps as a postdoc.

Just a month before this, Elizabeth Fine defended her dissertation titled "Microstructure observations of mixing and turbulent heat fluxes in the western Arctic Ocean”, co-chaired by Matthew Alford and Jennifer MacKinnon. Effie is now at WHOI as an institutional postdoc.

Congratulations to them both and we wish you the best of luck in your future endeavors!